Open Data & ERDDAP
Overview
Teaching: 10 min
Exercises: 0 minQuestions
What is open data?
What is ERDDAP?
Why is ERDDAP important for data reuse?
Objectives
Understand all the different factors for reusing online data with ERDDAP
Open Data
Open data = Documenting and sharing research data openly for re-use. Data sharing benefits scientific advancement by promoting transparency, encouraging collaboration, accelerating research and driving better decision-making.
Accordingly, there is an ongoing global data revolution that seeks to advance collaboration and the creation and expansion of effective, efficient research programs. When applying for grants nowadays, it is often required to share your data with the public:
- NSF-OCE: Sample and Data Policy NSF Division of Ocean Sciences: “PIs are expected to share with other researchers and the public, …, the data, samples, physical collections, and other supporting materials created or gathered in the course of work under NSF grants.”
- Ocean Observatory Initiative: OOI Data Policy: In principle, all OOI data will be made publicly available, free of charge, to anyone.
- Biogeochemical Argo: data management rules: data are made publicly available
When making your data freely available, it is important that end-users reusing data have all the knowledge necessary to be able to trust and understand the data they want to re-use. End-users can be both humans and computers. Metrics to see if a package is truly “Open Data” are the F.A.I.R principles.
Repositories are here to make the journey to open data easier: juggling data principles and policies, funding requirements, publication specifications, research specifics, archiving and discovery through online search engines. Repository types range from general repositories, which curate heterogeneous types of data, to Institutional repositories who are more familiar with the research at the institution to domain specific repositories (such as BCO-DMO). Domain-specific repositories have the role to make sure the data they receive have the correct domain- specific, standardized metadata and make them publicly available.
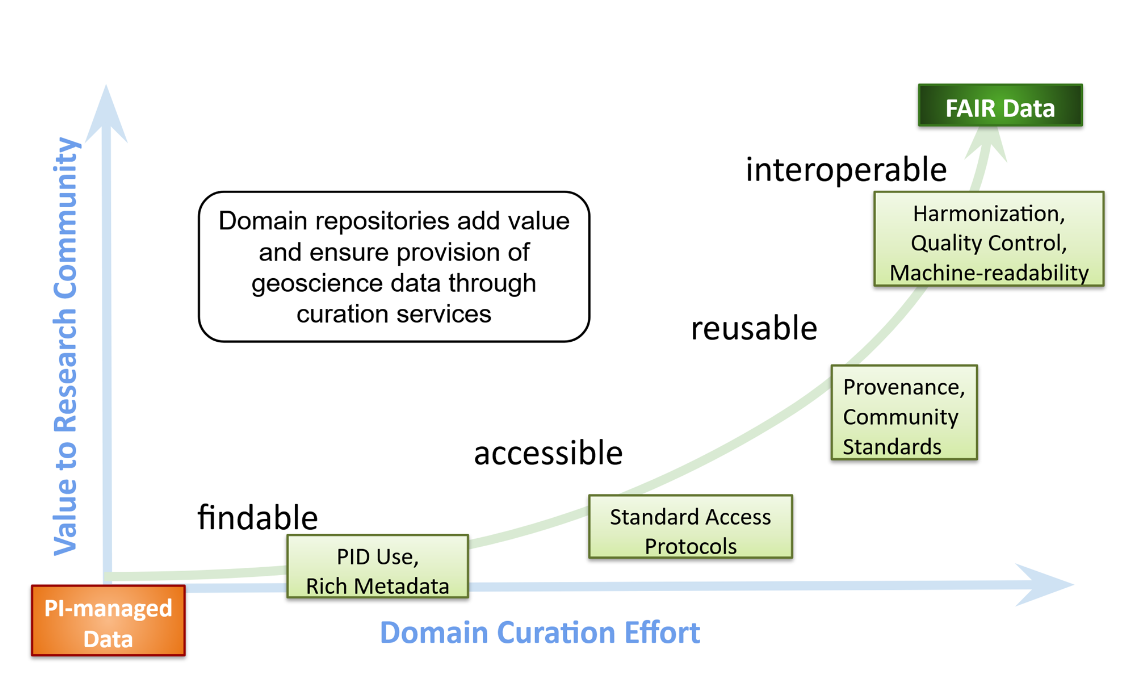
So in short, the data life cycle follows this pattern: Data acquisition & analysis -> Data publication & preservation -> Data Reuse (multiple researchers)
Aligning data sources
Once you have made your data online available for people to re-use it, there can often still be barriers that stand in the way of easily doing so. Reusing data from another source is difficult:
- different way of requesting data
- different formats: you work with R while colleague is working with Matlab and the other one with python
- Need for standardised metadata
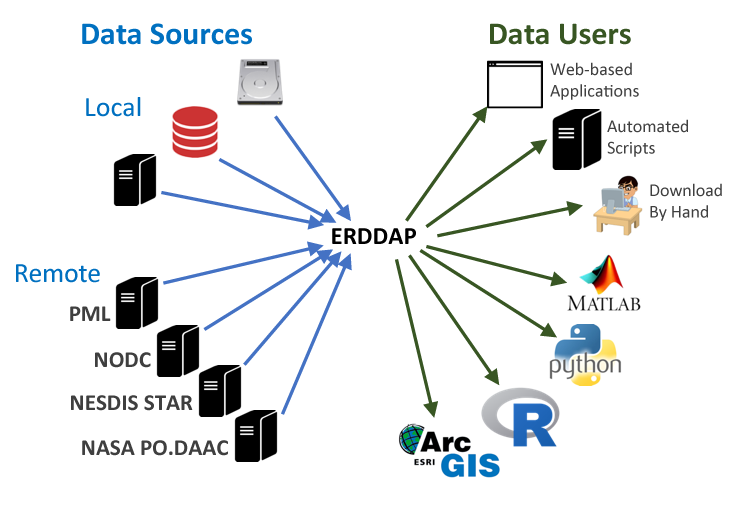
This is where ERDDAP comes in. It gives data providers the ability to, in a consistent way, download subsets of gridded and tabular scientific datasets in common file formats and make graphs and maps.
Specific ERDDAP servers
There is no “1 ERDDAP server”, instead organisations and repositories have their own erddap server to distribute data to end users. These users can request data and get data out in various file formats. Many institutes, repo’s and organizations (including NOAA, NASA, and USGS) run ERDDAP servers to serve their data.
Each repository and/or program has its own type of data it is serving. To export data from a repository it is always useful to have a bit of a background of what data the serves contains and how the data structure is. For this workshop, we will use data from the following repositories and programs:
-
Serves data and information from biological, chemical and biogeochemical research conducted in coastal, marine, great lakes and laboratory environments. (Supporting mainly NSF OCE bio & Chem sections)
-
BCO-DMO ERDDAP Server: https://erddap.bco-dmo.org/erddap/index.html
- The OOI consists of five marine scientific arrays located in the North and South Atlantic and Pacific Oceans delivering real-time data from more than 800 instruments
- OOI ERDDAP Server: https://erddap.dataexplorer.oceanobservatories.org/erddap/index.html
- The Global Argo Float program has almost 4000 real-time floats around the world that drift with the ocean currents and move up and down between the surface and a mid-water level.
- Unfortunately, because of the complexity and international nature of the program, there isn’t one “perfect” source to retrieve Argo data, or even to search for drifters you may be interested in.
- ERDDAP Server: http://www.ifremer.fr/erddap/index.html
Poll
Have you ever made data from a research project available online (either through a repository or the organisation)?
Have you ever reused data from a data provider?
Key Points
Open data is documentation and sharing research data openly for re-use:
Reusing data from another source can be challenging
ERDDAP provides the ability to download data in common file formats :
Finding data in the ERDDAP data catalog
Overview
Teaching: 25 min
Exercises: 10 minQuestions
How do I search for data in ERDDAP?
What information does a dataset hold?
How can I subset a dataset?
How do I make a graph in ERDDAP?
Objectives
Understand all the different factors for reusing online data with ERDDAP
Exploring an ERDDAP data catalog
In the chapter before we have seen that there are many ERDDAP servers to chose from. In this chapter we will dive a bit deeper in how to search for data in an ERDDAP catalog.
Finding data
For this example, we will use the ERDDAP operated by BCO-DMO: go to:
https://erddap.bco-dmo.org/erddap/index.html
To view all the available datasets on this erddap server click “View a List of all 1095 datasets”
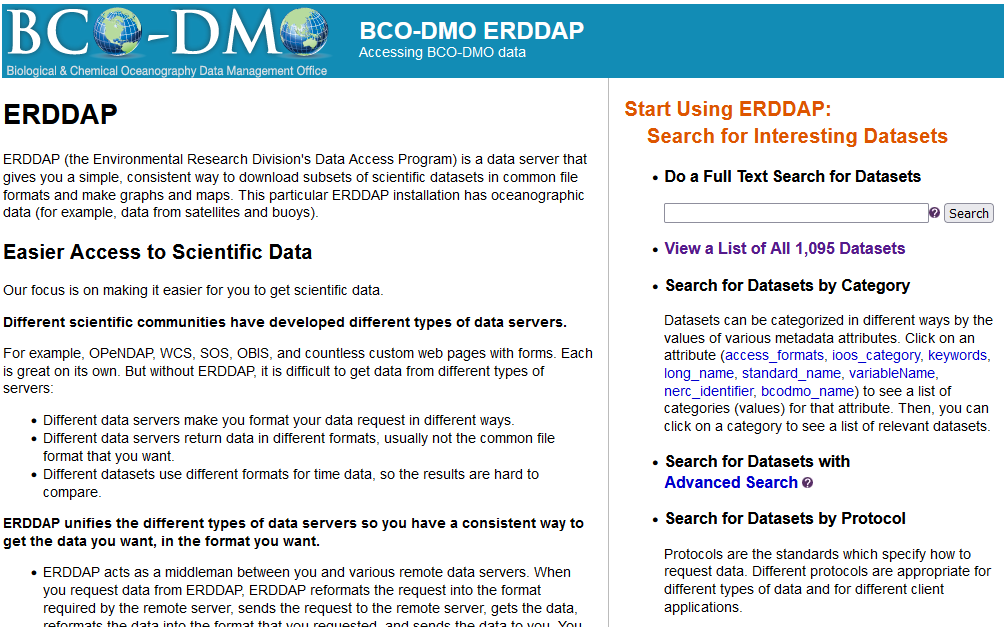
Let’s now search the database for specific data. Let’s search for CTD data in the Ross Sea from 2017. Type in search box: ctd “Ross Sea” 2017. This is a full text search, just like Google, use white spaces in between words and double quotes “” around phrases
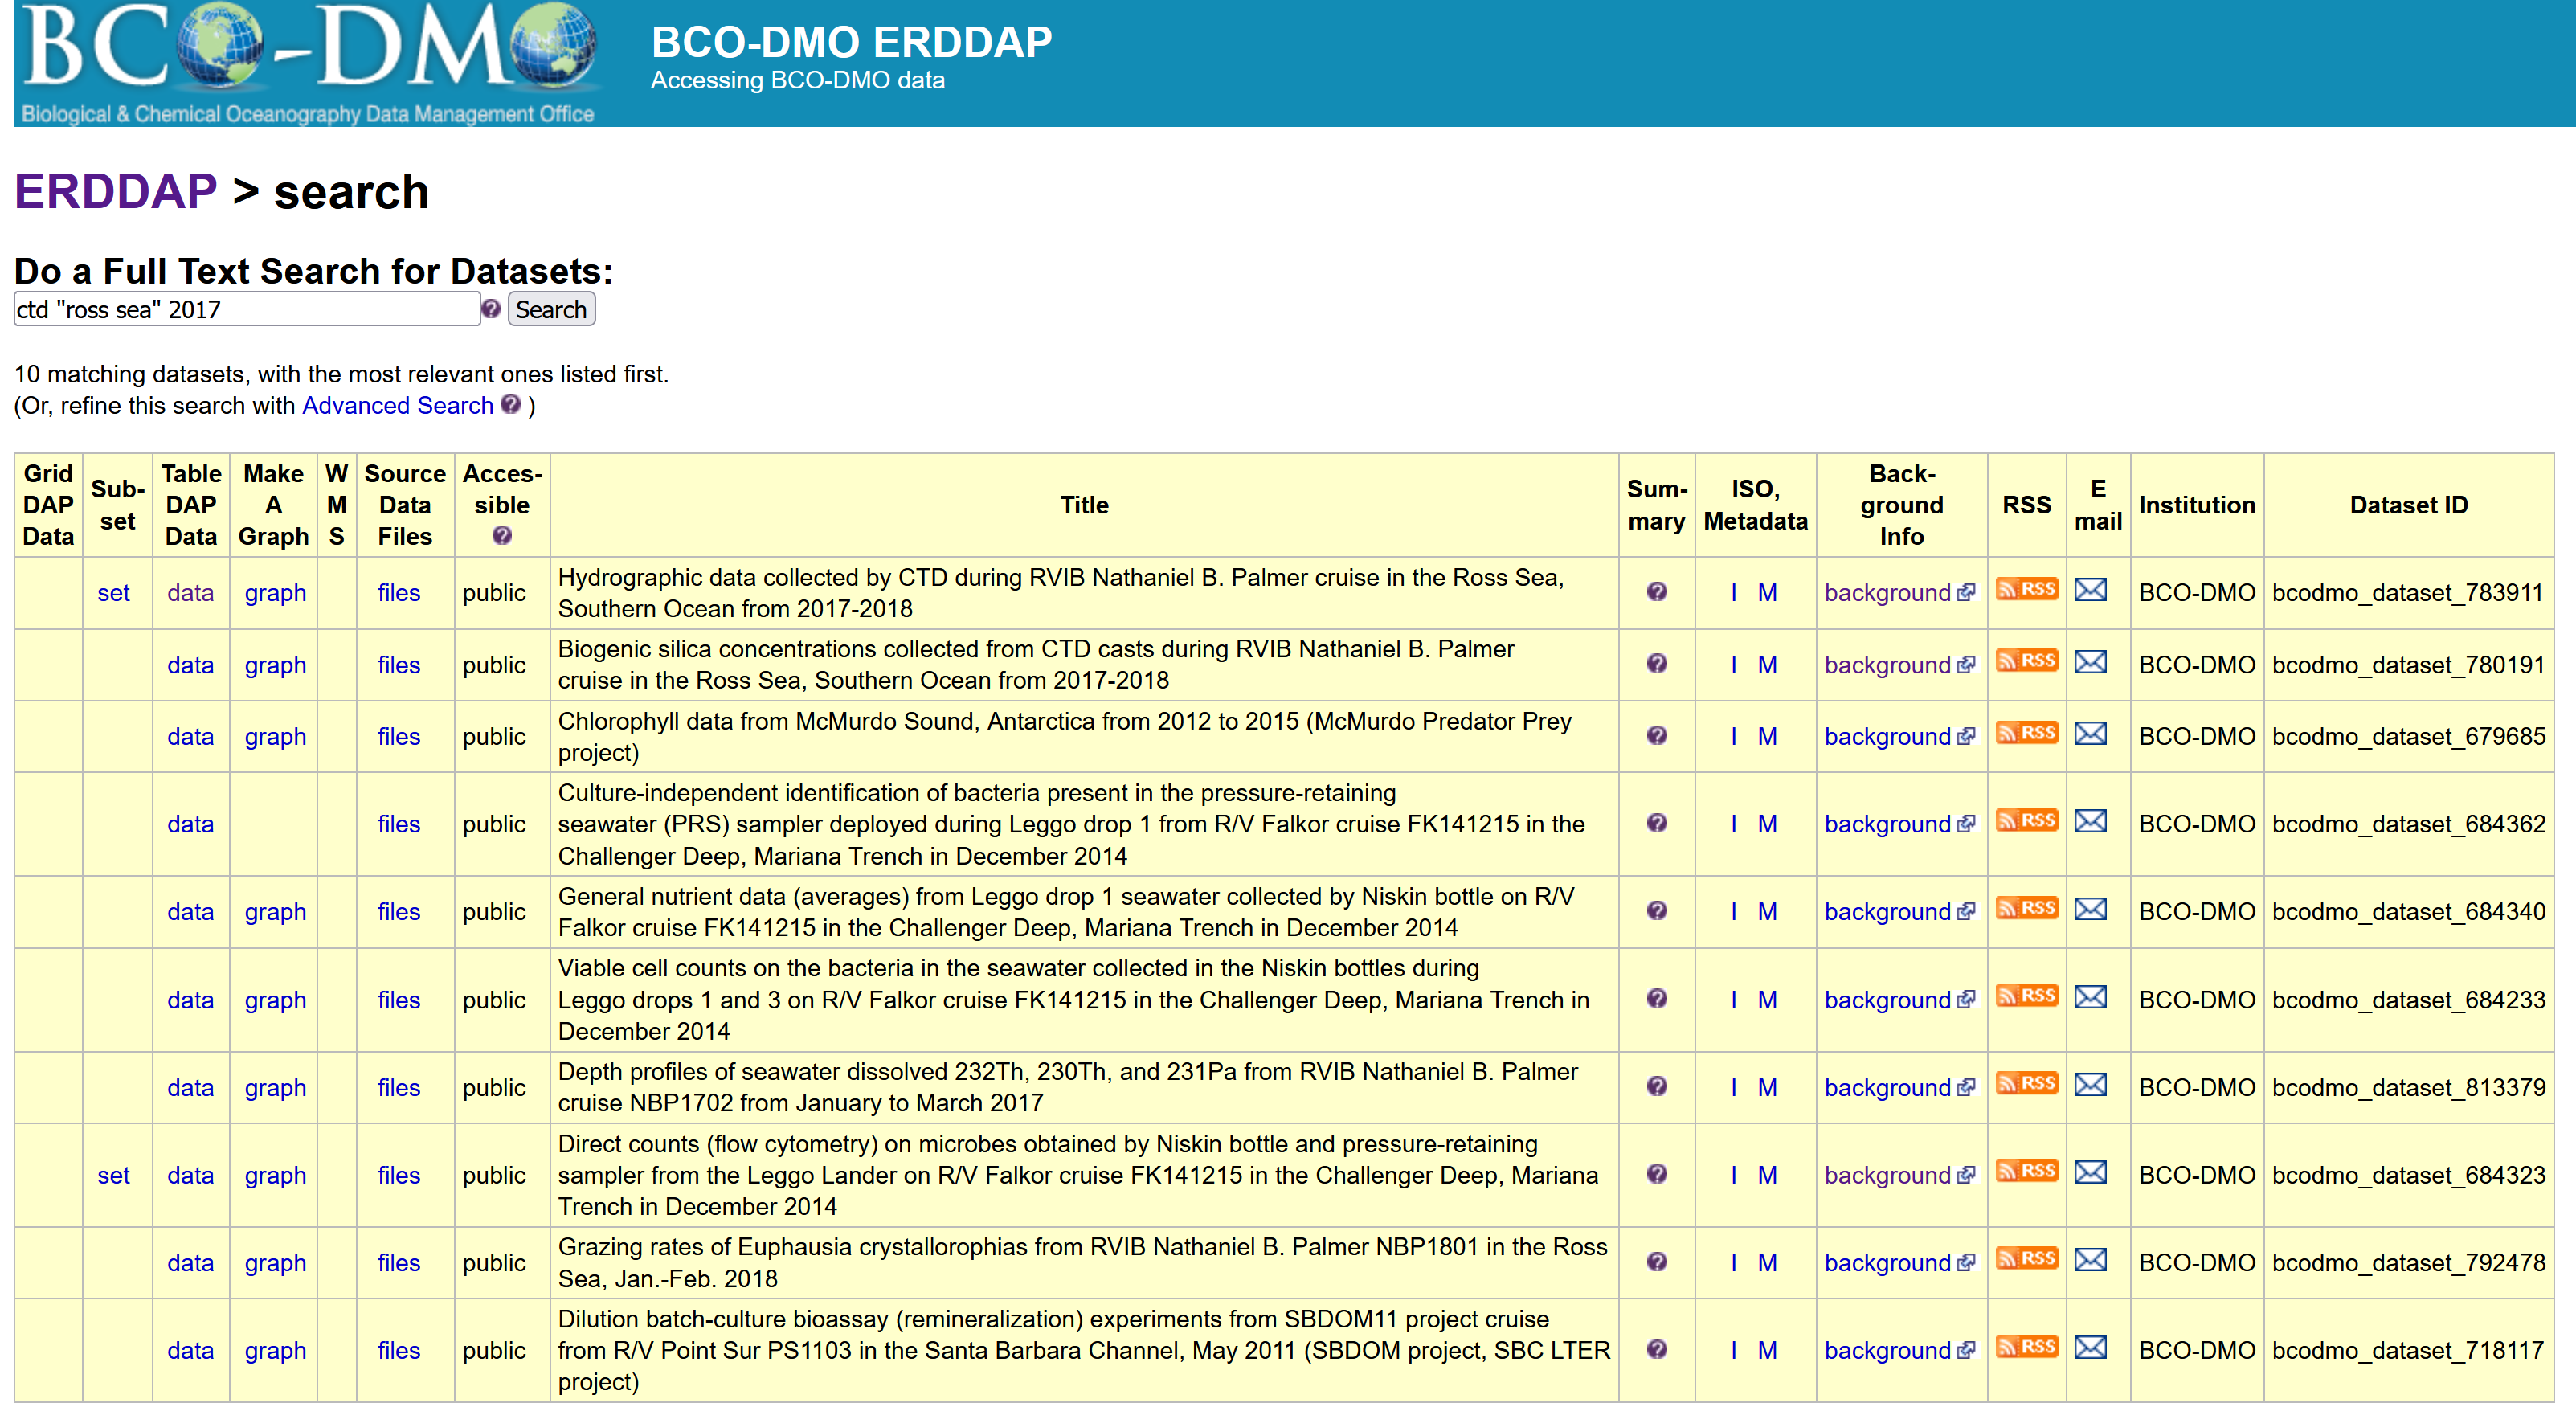
There are a couple of datasets that are popping up in this search, but let’s choose the one with DatasetID: bcodmo_dataset_783911.
Dataset information
Within the search results you have access to information about each dataset to help you decide with which dataset is useful for your application.

The listing (pictured above) gives access to a lot of information about the dataset. In a browser, try the following:
- Mouse over the question mark
?under Summary to get an overview of the dataset. - Click “Background info” to get more complete information from the data provider about the dataset. Now go back to the search results page.
- Click the
"M"under “ISO,Metadata” to see all of the dataset metadata. A lot of information is displayed. Some important fields are:- Global attributes (general metadata) vs variable attributes (variable names & units)
"geospatial_lat_min","geospatial_lat_max","geospatial_lon_min", and"geospatial_lon_max"for the spatial coverage"references"for citing the dataset in publications"license"for restrictions on using the data"acknowledgement"often used to describe how to acknowledge use of the dataset- time: ERDDAP standardizes the dates+times in the results. Data from other data servers is hard to compare because the dates+times often are expressed in different formats (for example, “Jan 2, 2018”, 02-JAN-2018, 1/2/18, 2/1/18, 2018-01-02, “days since Jan 1, 1900”). For string times, ERDDAP always uses the ISO 8601:2004(E) standard format, for example, 2018-01-02T00:00:00Z. For numeric times, ERDDAP always uses “seconds since 1970-01-01T00:00:00Z”. ERDDAP always uses the Zulu (UTC, GMT) time zone to remove the difficulties of working with different time zones and standard time versus daylight saving time.
These standardised variables are important for the dataset to be able to be “read” by other end-users and machines.
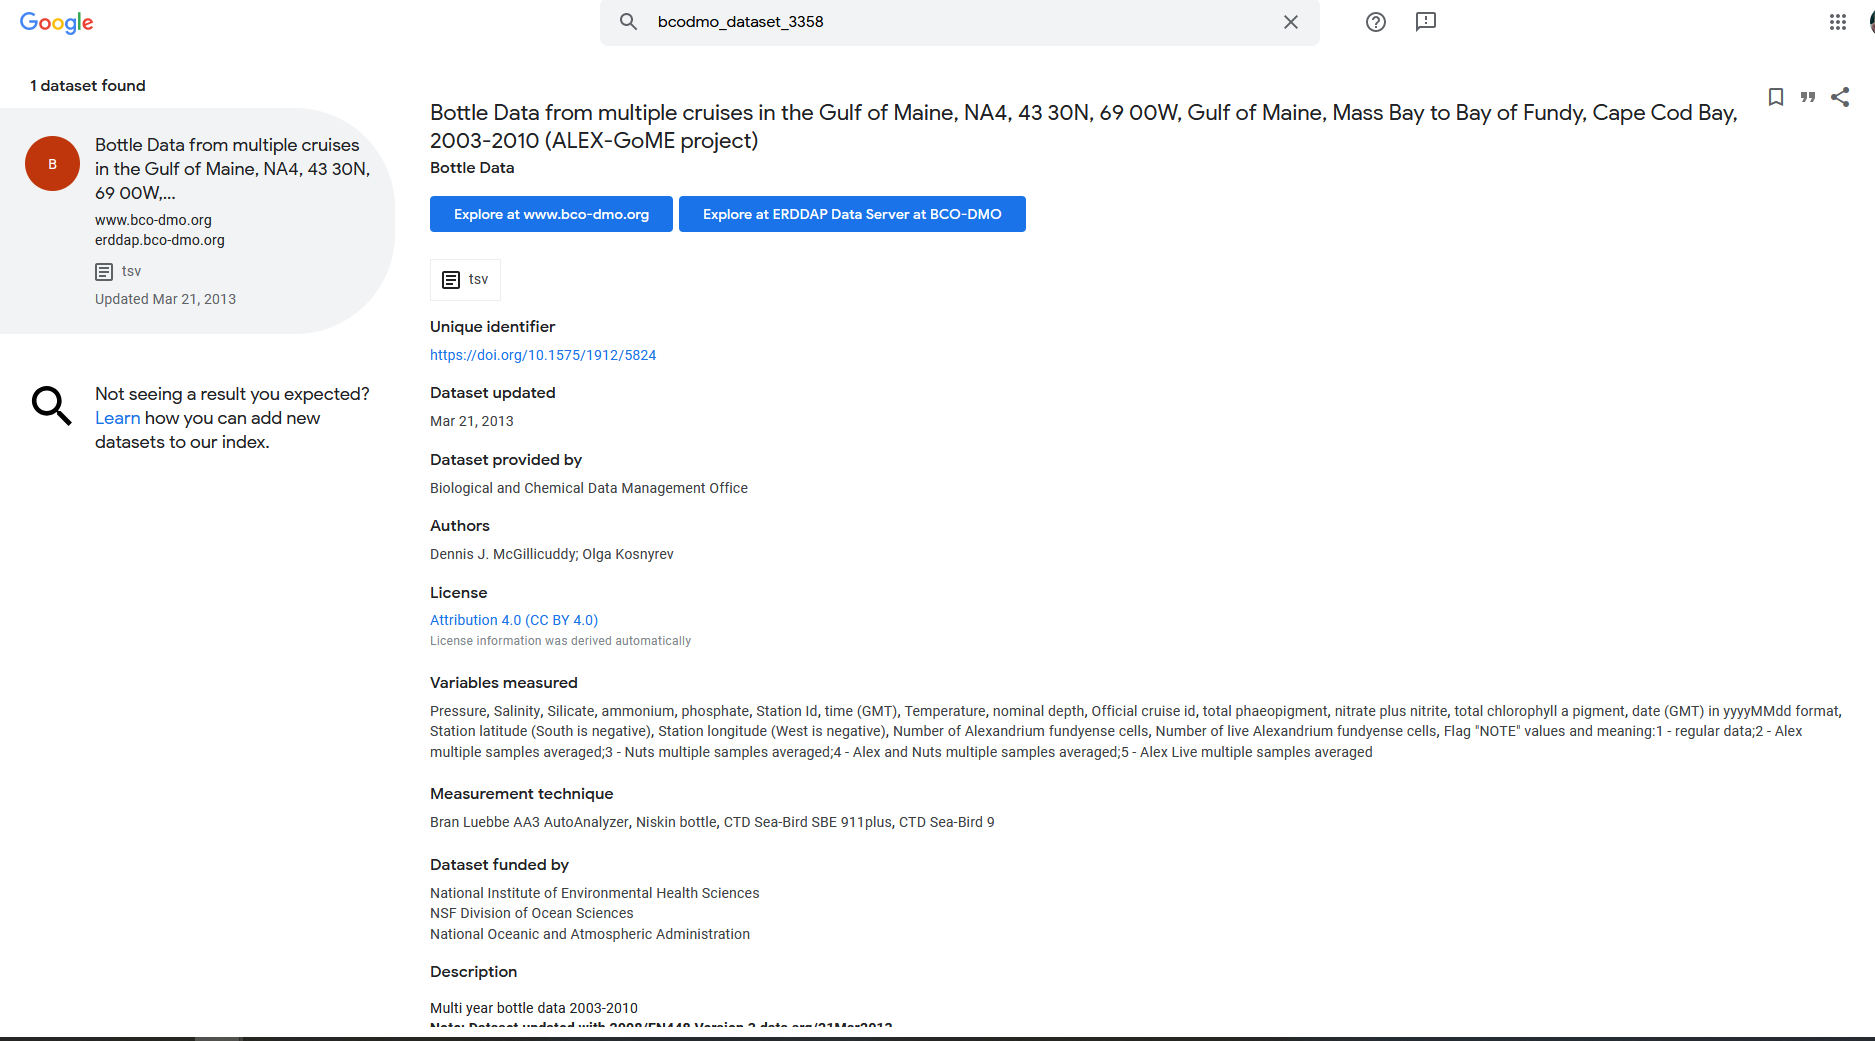
For example Google dataset search:
-
open google dataset search: https://datasetsearch.research.google.com/
-
search for the dataset id of the dataset above: bcodmo_dataset_783911
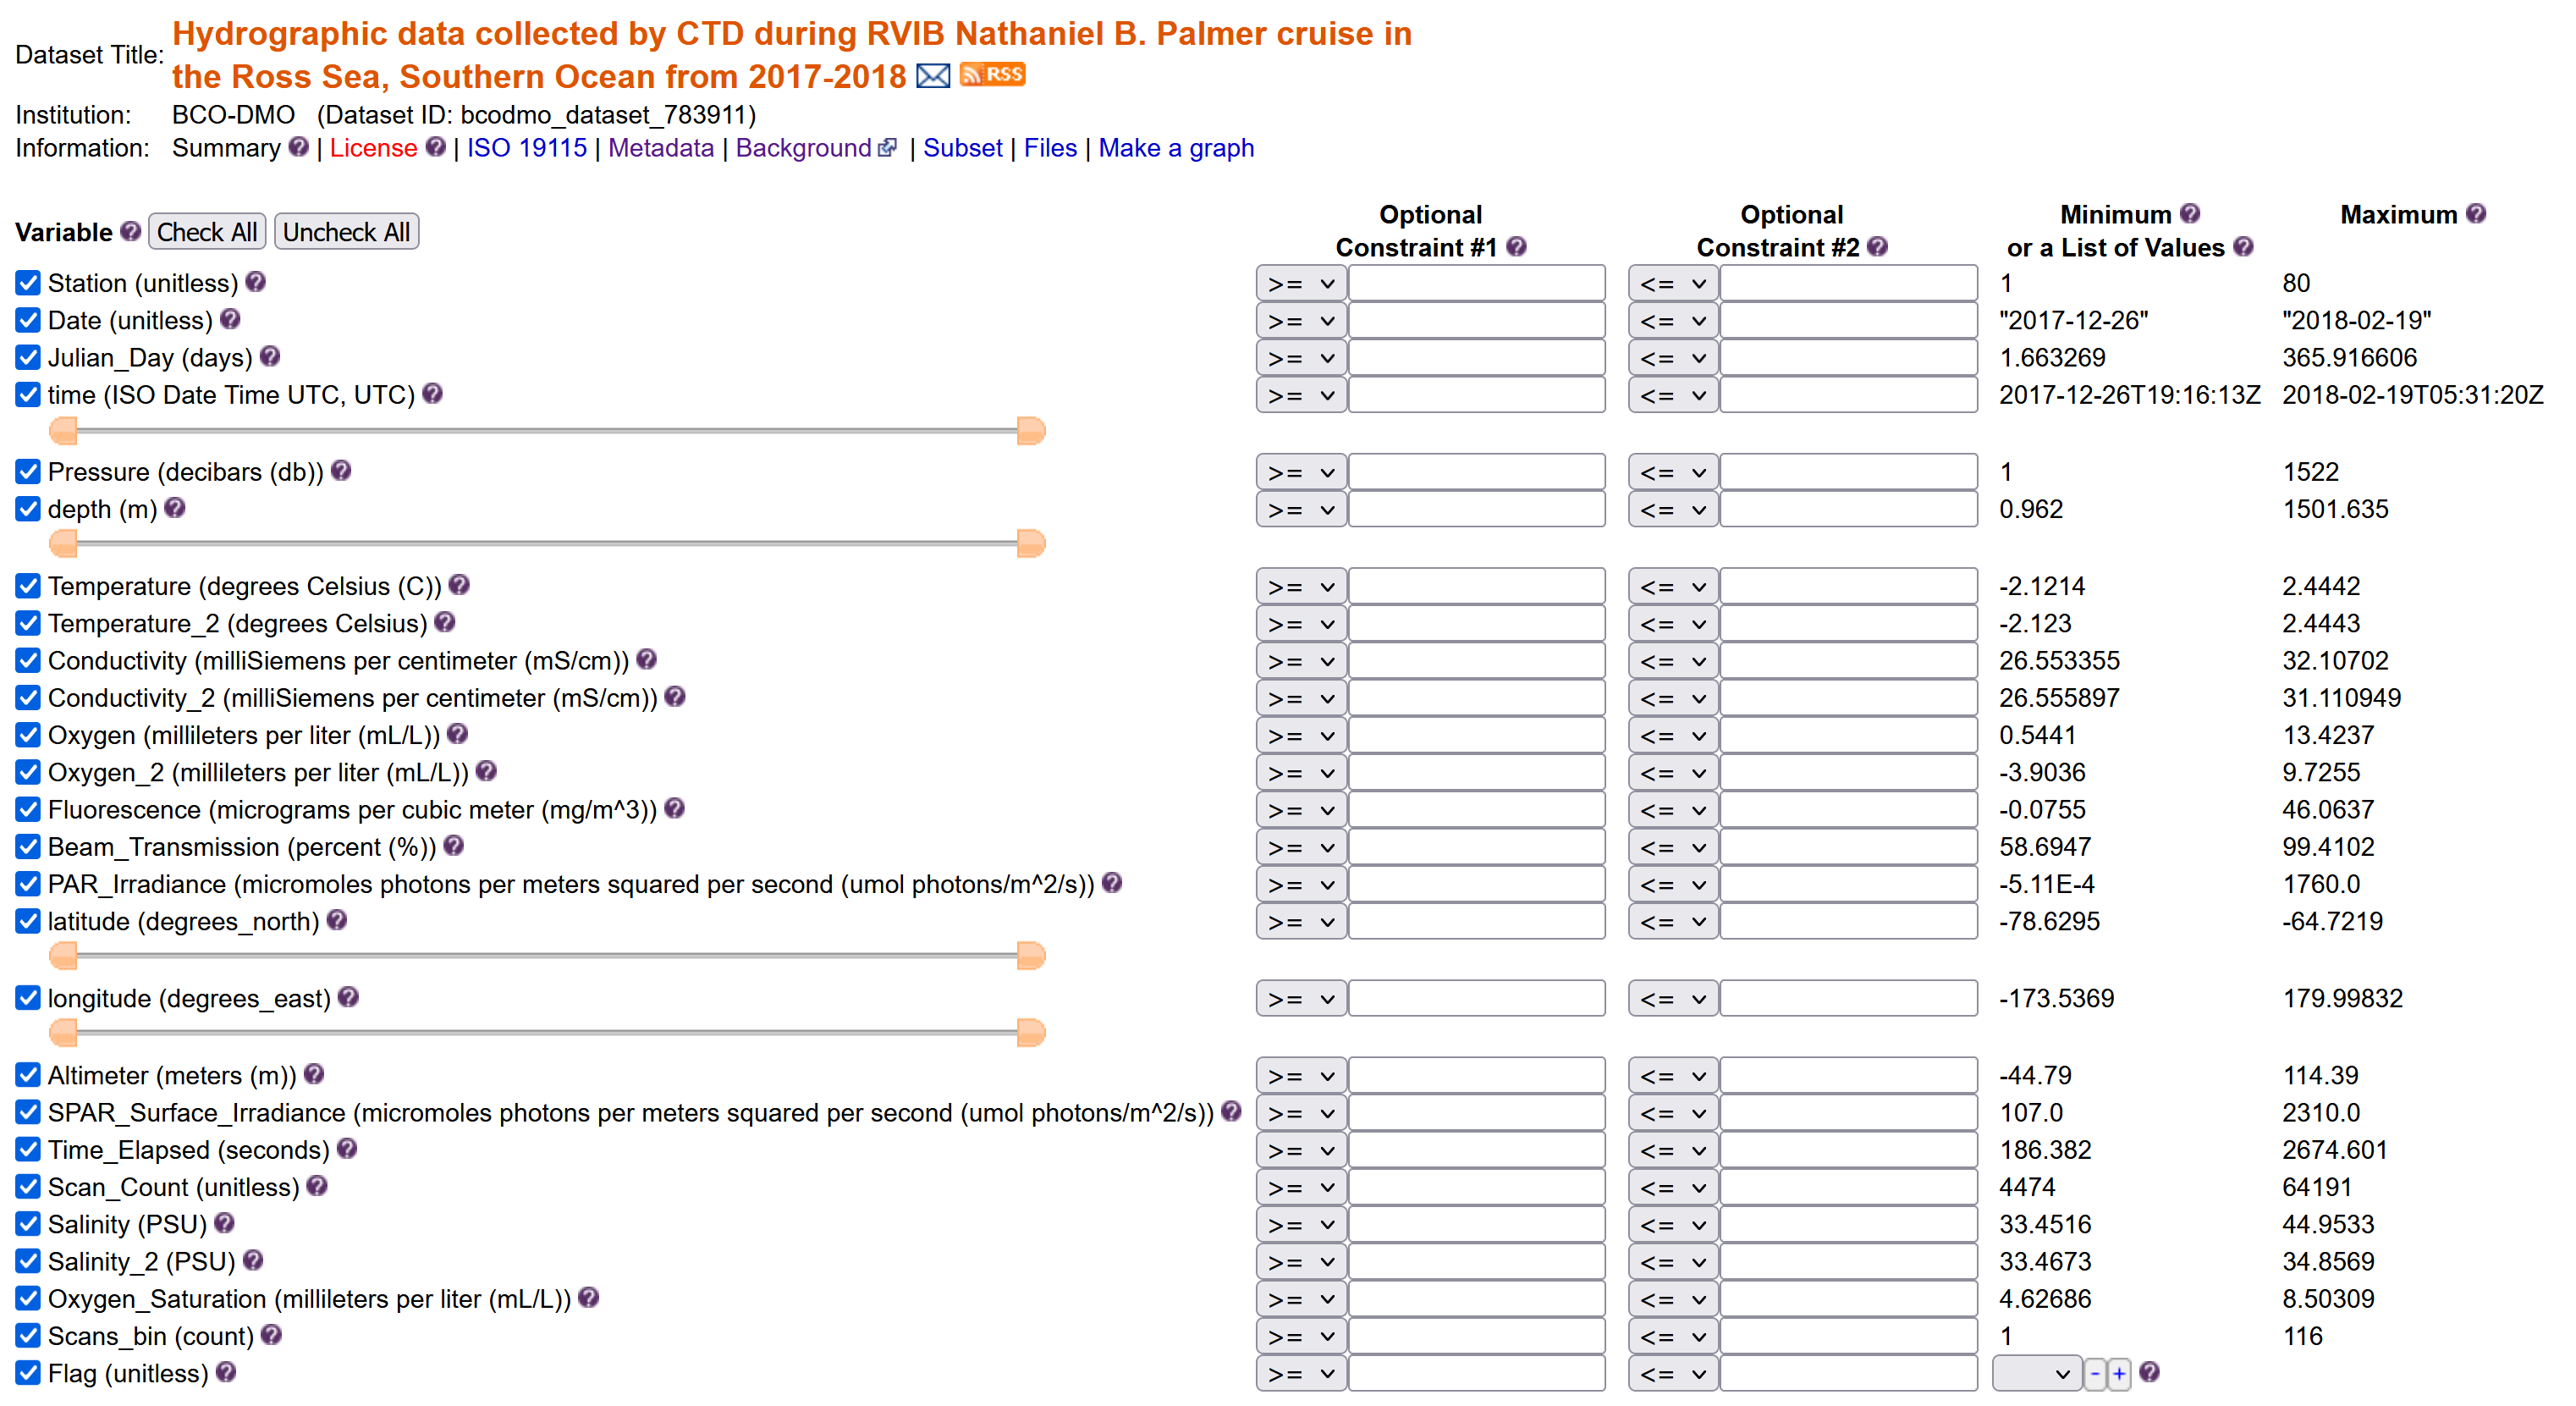
Subsetting data
Click on the data button. Here is the link to the dataset in erddap: https://erddap.bco-dmo.org/erddap/tabledap/bcodmo_dataset_783911.html
Set the file type
Download the data “Submit”
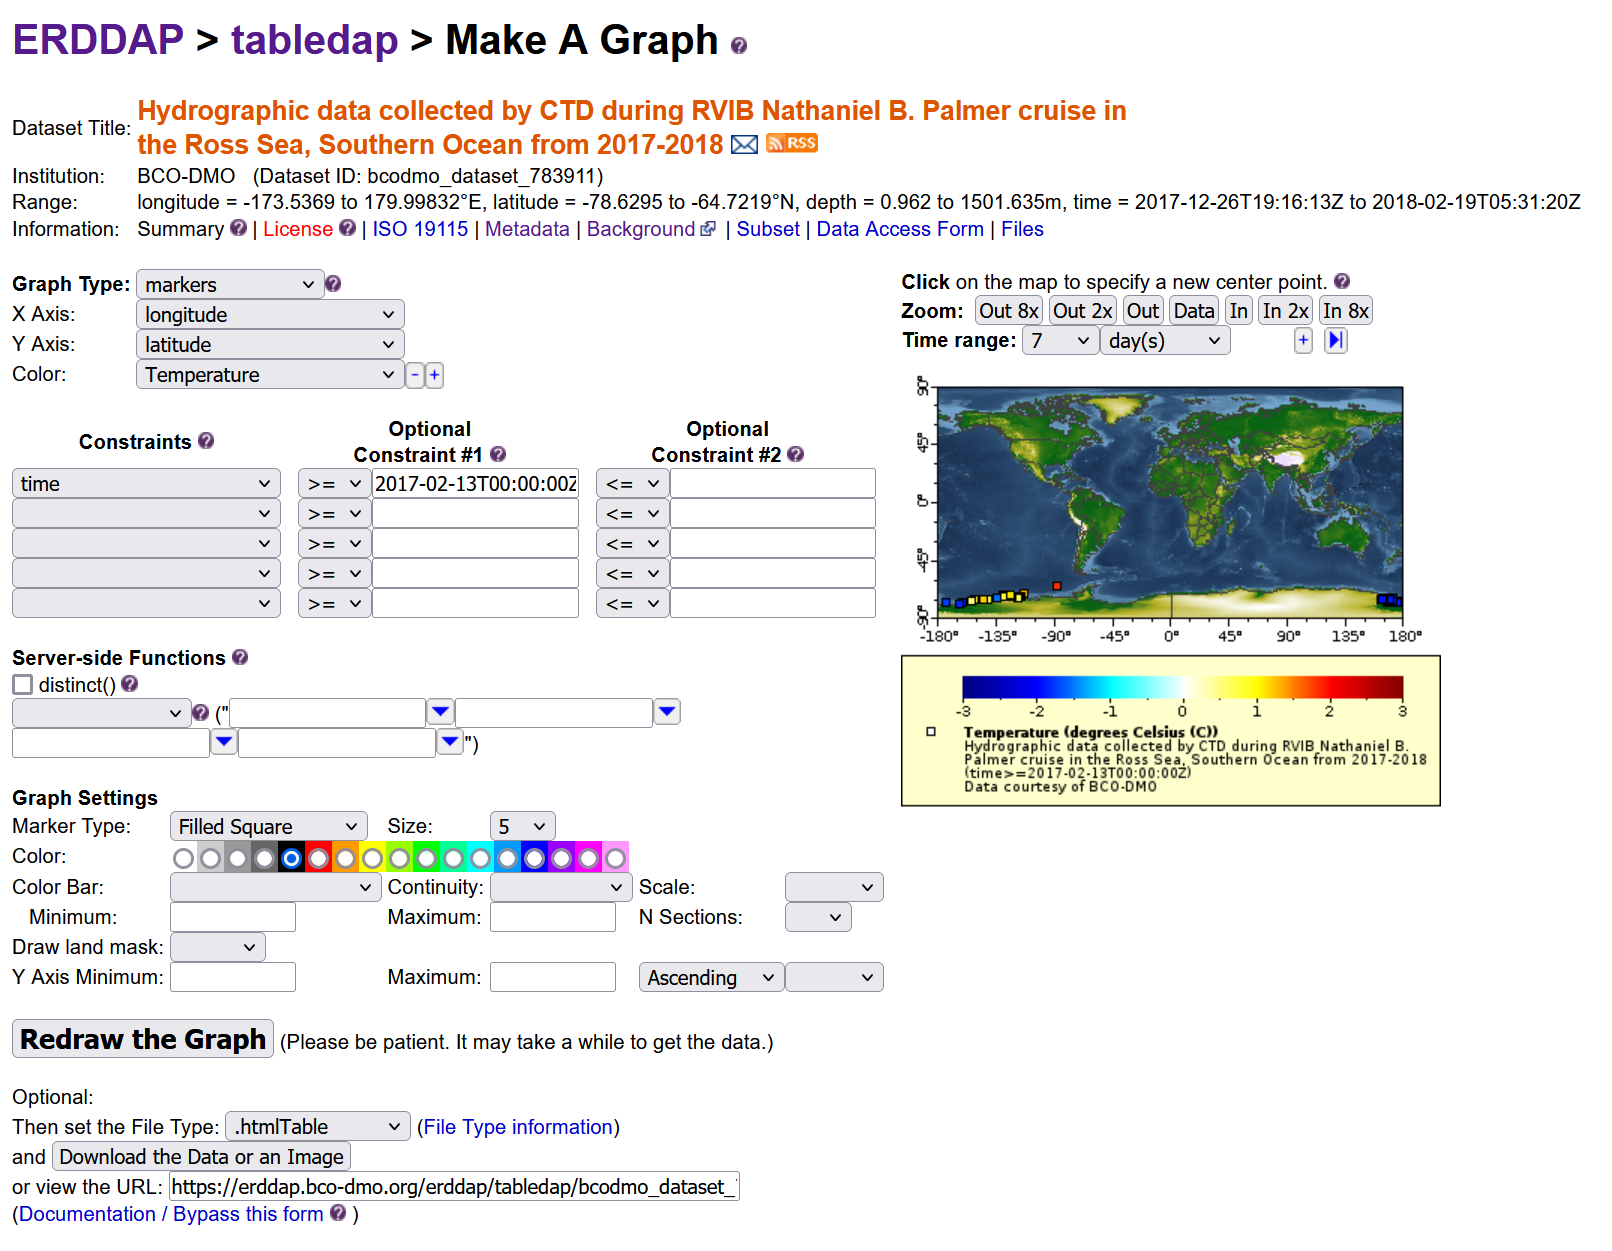
Create a graph
ERRDAP also provides a graph function for your datasets, but I will not go into this more in detail.
Exercise: Inspect BGC-Argo data
- Go to the ERDDAP server: https://polarwatch.noaa.gov/erddap/.
- search “Biogeochemical-Argo” .
- Q: how many datasets are being returned?
- Q: What is the difference between the datasets? (Does the title give something away?)
- Q: What is the time range the datasets have? (Hint click data tab)
- Download a dataset in .csv format that ranges in time from May 1st, 2015 until May 3rd 2015
Key Points
Searching an ERDDAP data catalog can be done using a web page
Data can be downloaded in different file formats
Constraints can be added to a dataset search
Data requests using an ERDDAP URL
Overview
Teaching: 30 min
Exercises: 10 minQuestions
What is ERDDAP REST API?
How does an ERDDAP URL endpoint look like?
How can I access data request?
Objectives
Creating the ERDDAP download URL
Downloading an ERRDAP table dataset with Python
We have just seen that we can search erddap for datasets. The main takeaways were:
-
ERDDAP is a tool and many repositories can have an ERDDAP server, which means that there are many erddap servers around.
- You can search 2 types of data, also called protocols: tabledap & griddap
- A dataset in ERDDAP can be downloaded in many different file types, based on what you need.
- You can subset a dataset based on constraining the variables.
In the next chapter, we’ll see that an ERDDAP can not only be used in the web interface like we did, but also as a URL that computer programs can use (in this case, to get data, graphs, and information about datasets).
The ERDDAP REST API Service
What is an API?
Shoutout to API workshop from Amber York:
API stands for Application Programming Interface. APIs are the glue that hold the technology universe together. They are a communication tool that can be used to pass information to and from different kinds of devices and hardware through requests and responses. Let’s look at a restaurant concept example.
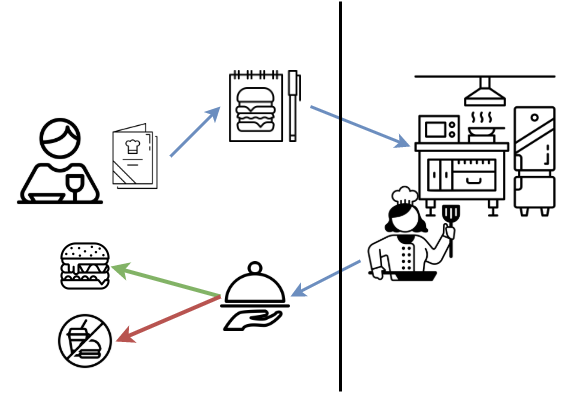
Concept: Restaurant as an API
- You request an item listed the menu.
- Your order is received by the kitchen.
- The kitchen performs all kinds of operations needed to make your food.
- Then then you get a response. Your food is either delivered to your table or you get no food if they couldn’t make your request. They can’t make your food if you ordered something that isn’t on the menu, you didn’t ask for it correctly, or if equipment failure prevented them from making your requested item.
API requests have to be made in specific ways so referring to Documentation is very important.
In this workshop we are focussing on the ERDDAP REST API. It is a medium for two computers to communicate over HTTP (Hypertext Transfer Protocol), in the same way clients and servers communicate.
ERDDAP request URLs
Requesting data from ERDDAP can be done using a URL. All information about every ERDAPP request is contained in the URL of each request, which makes it easy to automate searching for and using data in other applications.
Tabledap request URLs must be in the form
- server/protocol/datasetID.fileType{?query }
- https://coastwatch.pfeg.noaa.gov/erddap/tabledap/pmelTaoDySst.htmlTable?longitude,latitude,time,station,wmo_platform_code,T_25&time%3E=2015-05-23T12:00:00Z&time%3C=2015-05-31T12:00:00Z
Thus, the query is often a comma-separated list of desired variable names, followed by a collection of constraints (e.g., variable<value), each preceded by ‘&’ (which is interpreted as “AND”).
Details:
-
Requests must not have any internal spaces.
-
Requests are case sensitive.
-
datasetID identifies the name that ERDDAP assigned to the source web site and dataset (for example, bcodmo_dataset_786013). You can see a list of datasetID options available via tabledap.
Building the URL of a dataset
Let’s manually create an ERDDAP URL to request a dataset with specific variables: open up notepad (++) or TextEdit
Links to the example dataset we will be using:
- BCO-DMO landing page: https://www.bco-dmo.org/dataset/815732
- ERDDAP page of dataset: https://erddap.bco-dmo.org/erddap/info/bcodmo_dataset_783911/index.html
1. ERDDAP server you want to get data
BCO-DMO ERDDAP server: https://erddap.bco-dmo.org/erddap
2. Protocol
Protocols are the standards which specify how to request data. Different protocols are appropriate for different types of data and for different client applications.
tabledap lets you request a data subset, a graph, or a map from a tabular dataset (for example, buoy data), via a specially formed URL
griddap lets you request a data subset, graph, or map from a gridded dataset (for example, sea surface temperature data from a satellite), via a specially formed URL
3. Dataset ID
The dataset id of our dataset previously used was: bcodmo_dataset_783911
4. Choose your file type
Specifies the type of table data file that you want to download. You can use different filetype based on your specific needs and your community, you can download files for matlab binary file, netcdf, .csv (for R and Python), GIS, etc. The column below gives all the formats available:
| Data fileTypes | Description |
|---|---|
| .asc | View OPeNDAP-style ISO-8859-1 comma-separated text. |
| .csv | Download a ISO-8859-1 comma-separated text table (line 1: names; line 2: units; ISO 8601 times). |
| .csvp | Download a ISO-8859-1 .csv file with line 1: name (units). Times are ISO 8601 strings. |
| .csv0 | Download a ISO-8859-1 .csv file without column names or units. Times are ISO 8601 strings. |
| .dataTable | A JSON file formatted for use with the Google Visualization client library (Google Charts). |
| .das | View the dataset’s metadata via an ISO-8859-1 OPeNDAP Dataset Attribute Structure (DAS). |
| .dds | View the dataset’s structure via an ISO-8859-1 OPeNDAP Dataset Descriptor Structure (DDS). |
| .dods | OPeNDAP clients use this to download the data in the DODS binary format. |
| .esriCsv | Download a ISO_8859_1 .csv file for ESRI’s ArcGIS 9.x and below (separate date and time columns). |
| .fgdc | View the dataset’s UTF-8 FGDC .xml metadata. |
| .geoJson | Download longitude,latitude,otherColumns data as a UTF-8 GeoJSON .json file. |
| .graph | View a Make A Graph web page. |
| .help | View a web page with a description of tabledap. |
| .html | View an OPeNDAP-style HTML Data Access Form. |
| .htmlTable | View a UTF-8 .html web page with the data in a table. Times are ISO 8601 strings. |
| .iso19115 | View the dataset’s ISO 19115-2/19139 UTF-8 .xml metadata. |
| .itx | Download an ISO-8859-1 Igor Text File. Each response column becomes a wave. |
| .json | View a table-like UTF-8 JSON file (missing value = ‘null’; times are ISO 8601 strings). |
| .jsonlCSV1 | View a UTF-8 JSON Lines CSV file with column names on line 1 (mv = ‘null’; times are ISO 8601 strings). |
| .jsonlCSV | View a UTF-8 JSON Lines CSV file without column names (mv = ‘null’; times are ISO 8601 strings). |
| .jsonlKVP | View a UTF-8 JSON Lines file with Key:Value pairs (missing value = ‘null’; times are ISO 8601 strings). |
| .mat | Download a MATLAB binary file. |
| .nc | Download a flat, table-like, NetCDF-3 binary file with COARDS/CF/ACDD metadata. |
| .ncHeader | View the UTF-8 header (the metadata) for the NetCDF-3 .nc file. |
| .ncCF | Download a NetCDF-3 CF Discrete Sampling Geometries file (Contiguous Ragged Array). |
| .ncCFHeader | View the UTF-8 header (the metadata) for the .ncCF file. |
| .ncCFMA | Download a NetCDF-3 CF Discrete Sampling Geometries file (Multidimensional Array). |
| .ncCFMAHeader | View the UTF-8 header (the metadata) for the .ncCFMA file. |
| .nccsv | Download a NetCDF-3-like 7-bit ASCII NCCSV .csv file with COARDS/CF/ACDD metadata. |
| .nccsvMetadata | View the dataset’s metadata as the top half of a 7-bit ASCII NCCSV .csv file. |
| .ncoJson | Download a UTF-8 NCO lvl=2 JSON file with COARDS/CF/ACDD metadata. |
| .odvTxt | Download longitude,latitude,time,otherColumns as an ISO-8859-1 ODV Generic Spreadsheet File (.txt). |
| .subset | View an HTML form which uses faceted search to simplify picking subsets of the data. |
| .tsv | Download a ISO-8859-1 tab-separated text table (line 1: names; line 2: units; ISO 8601 times). |
| .tsvp | Download a ISO-8859-1 .tsv file with line 1: name (units). Times are ISO 8601 strings. |
| .tsv0 | Download a ISO-8859-1 .tsv file without column names or units. Times are ISO 8601 strings. |
| .wav | Download a .wav audio file. All columns must be numeric and of the same type. |
| .xhtml | View a UTF-8 XHTML (XML) file with the data in a table. Times are ISO 8601 strings. |
In this lesson we will use the .csv file type to import it in Jupyter Notebook and work with the Pandas library.
IMPORTANT NOTE: The actual extension of the resulting file may be slightly different than the fileType (for example, .htmlTable returns an .html file). To get a .csv file with the header names in the first row the file type is .csvp.
5. Data request
-
The data request in the URL starts with
? -
Then add the variables of interest: all variables
-
The query is a comma-separated list of desired variable names, followed by a collection of constraints (e.g., variable<value), each preceded by ‘&’ (which is interpreted as “AND”).
Variables that can be added to your URL: https://erddap.bco-dmo.org/erddap/info/bcodmo_dataset_783911/index.html -> it is case sensitive!
We want the following variables: Station, time, Temperature (between 0 and 2), latitude, longitude
6. URL outcome
https://erddap.bco-dmo.org/erddap/tabledap/bcodmo_dataset_783911.htmlTable?Station,time,Temperature,latitude,longitude&Temperature>=0&Temperature<=2
Note: you can also get the URL using the ERDDAP web interface by clicking the “Just generate the URL” button: https://erddap.bco-dmo.org/erddap/tabledap/bcodmo_dataset_783911.htmlTable?Station%2Ctime%2CTemperature%2Clatitude%2Clongitude&Temperature%3E=0&Temperature%3C=2
Access
Web browser
What happens when you copy and past that URL into a web browser?

Command line
You can use curl on command line/Terminal to make requests and get responses.
$ curl https://erddap.bco-dmo.org/erddap/tabledap/bcodmo_dataset_783911.htmlTable?Station,time,Temperature,latitude,longitude&Temperature>=0&Temperature<=2
Exercise:
- Add the Fluorescence variable to your URL request
- Constrain it to value between 0 and 40
Download the dataset with Python
In the previous chapter we saw that we could download a dataset from erddap pushing a button.
Live coding demo
Link to static Jupyter Notebook. Copy/Paste the code blocks into your own Jupyter Notebook
Opening a Jupyter Notebook on your own computer:
- Open anaconda prompt or terminal
- Activate erddap environment
conda activate erddap - Go to the location where you want your notebook to be:
dirorlsandcdcommands are useful - jupyter notebook in command line
- go to new -> Python 3
We just build the following URL in an exercise:
https://erddap.bco-dmo.org/erddap/tabledap/bcodmo_dataset_783911.htmlTable?Station,time,Temperature,latitude,longitude&Temperature>=0&Temperature<=2
Let’s now download it with python to our computer locally.
The urllib.request library helps with opening URLs. It is part of the erddapy package that you have installed. Import this package into the Python environment to work with url’s in your environment
# Import the urllib library
import urllib.request
Some characters cannot be part of a URL, like ‘,’and ‘>’. When pasting a URL with comma’s into your webbrowser it automatically translates those carachers into a different encoding before transmission.
#define the url you want to download
download_url = "https://erddap.bco-dmo.org/erddap/tabledap/bcodmo_dataset_783911.csv?Station,time,Temperature,latitude,longitude&Temperature%3E=0&Temperature%3C=2"
# Define where you want to save the file on your computer
name_to_save = "bcodmo_dataset_815732.csv"

# download the dataset
urllib.request.urlretrieve(download_url, name_to_save)
Import the Pandas library to work with tables in your Python environment.
# Import the downloaded .csv data into jupyter notebooks with the package Pandas
import pandas as pd
pd.read_csv ("bcodmo_dataset_815732.csv")
dataframe = pd.read_csv ("bcodmo_dataset_815732.csv", dtype='unicode')
print (dataframe)
Key Points
Tabledap request URLs are in the form: server/protocol/datasetID.fileType{?query}
urllib library works with https protocols
Online data to your Python environment
Overview
Teaching: 25 min
Exercises: 20 minQuestions
How do I import an ERDDAP dataset into Python?
How do I interact with the dataset in Python
Objectives
Importing data from an ERDDAP server into your Python environment
Interact with data
ERDDAPY library
In the previous lesson, we downloaded our dataset file to our local machine. Now we will not download it to your local machine, but use in in your python environment directly.
Erddapy is a package that takes advantage of ERDDAP’s RESTful web services and creates the ERDDAP URL for any request, like searching for datasets, acquiring metadata, downloading the data, etc.You can create virtually any request like, searching for datasets, acquiring metadata, downloading data, etc.
Link to static Jupyter Notebook. Copy/Paste the code blocks into your own Jupyter Notebook
Import BCO-DMO temperature dataset - Oregon Coast
Part 1: Create the URL
From the dataset above, we are going to import the variables longitude, latitude, time and Temperature. The time constraints will be netween January 13th and January 16th.
Step 1: Initiate the ERDDAP URL constructor for a server ( erddapy server object).
#Import erddap package into
from erddapy import ERDDAP

e = ERDDAP(
    server= "https://erddap.bco-dmo.org/erddap/",
    protocol="tabledap",
    response="csv",
)
Step 2: Populate the object with a dataset id, variables of interest, and its constraints. We can download the csvp response with the .to_pandas method.
e.dataset_id = "bcodmo_dataset_817952"
e.variables = [
    "longitude",
    "latitude",
    "time",
    "Temperature"
]
e.constraints = {
    "time>=": "2017-01-13T00:00:00Z",
    "time<=": "2017-01-16T23:59:59Z",}
Check the URL
# Print the URL - check
url = e.get_download_url()
print(url)
Part 2: Import your dataset into pandas
We can import the csv response using the erddapy the .to_pandas method.
# Convert URL to pandas dataframe
df_bcodmo = e.to_pandas(
    parse_dates=True,
).dropna()
Check out your dataset in pandas
# print the dataframe to check what data is in there specifically.
df_bcodmo.head()
# print the column names
print (df_bcodmo.columns)
There is a weird name in the title, rename the column to correct this
df_bcodmo.rename(columns={df_bcodmo.columns.values[3]: 'Temperature (degrees Celsius)'}, inplace=True)
print (df_bcodmo.columns)
Subset the tabular data further in pandas based on the time Step 1: convert the time to a datetime object to take out the time
import pandas as pd
# convert to datetime object to be able to work with it in pandas
print (df_bcodmo.dtypes)

df_bcodmo["time (UTC)"] = pd.to_datetime (df_bcodmo["time (UTC)"], format = "%Y-%m-%dT%H:%M:%S")
print (df_bcodmo.dtypes)
Only select the rows for January 13th
df_bcodmo_13 =  df_bcodmo[df_bcodmo["time (UTC)"].dt.day == 13]
df_bcodmo_13
When you inspect the dataset, you can see that some hours have multiple data points, while others have only 1 data point. Let’s average the dataset over every hour using the groupby function
df_bcodmo_13_average = df_bcodmo_13.groupby(df_bcodmo["time (UTC)"].dt.hour)[['Temperature (degrees Celsius)','longitude (degrees_east)','latitude (degrees_north)']].mean().reset_index()
df_bcodmo_13_average
Plot your averaged dataset in pandas
df_bcodmo_13_average.plot (
    x='longitude (degrees_east)',
    y='latitude (degrees_north)',
    kind = 'scatter',
    c='Temperature (degrees Celsius)',
    colormap="YlOrRd")
Exercise:
Create the URL for this dataset with the variable POC instead of temperature
Answer
#Import erddap package into  from erddapy import ERDDAP

e = ERDDAP(
server= "https://erddap.bco-dmo.org/erddap/",
protocol="tabledap",
response="csv", )

e.dataset_id = "bcodmo_dataset_817952"
e.variables = [
"longitude",
"latitude",
"time",
"POC" ]
e.constraints = {
"time>=": "2017-01-13T00:00:00Z",
"time<=": "2017-01-16T23:59:59Z",}

#Print the URL - check
url = e.get_download_url()
print(url)
Searching datasets using erddapy
Step 1: Initiate the ERDDAP URL constructor for a server ( erddapy server object).
#searching datasets based on words
from erddapy import ERDDAP
e = ERDDAP(
    server="https://erddap.bco-dmo.org/erddap",
    protocol="tabledap",
    response="csv")
Search with keywords:
import pandas as pd
url = e.get_search_url(search_for="Temperature OC1603B", response="csv")

print (url)
pd.read_csv(url)["Dataset ID"]
Inspect the metadata of dataset with id bcodmo_dataset_817952:
#find the variables
info_url = e.get_info_url(dataset_id="bcodmo_dataset_817952")
pd.read_csv(info_url)

pd.set_option('display.max_rows', None) #make sure that jupyter notebook shows all rows
dataframe = pd.read_csv(info_url)
print (dataframe)
#get the unique variable names with pandas
dataframe["Variable Name"].unique()
Exercise: Inspect this BCO-DMO dataset
- What are the units of POC?
- Who is the Principal Investigator on this dataset?
- What is the start and end time of this dataset?
Exercise
What are the unique variables for “bcodmo_dataset_807119?”
Answer
# find the variables
info_url = e.get_info_url(dataset_id="bcodmo_dataset_807119")
pd.read_csv(info_url)

pd.set_option('display.max_rows', None) #make sure that jupyter notebook shows all rows
dataframe = pd.read_csv(info_url) dataframe

# get the unique variable names with pandas
dataframe["Variable Name"].unique()
RERRDAP: package for R users to work directly with erddap servers
Information an using erddap: https://docs.ropensci.org/rerddap/articles/Using_rerddap.html
Example from the following page: OOI Glider Data (accessed October 11, 2021):
The mission of the IOOS Glider DAC is to provide glider operators with a simple process for submitting glider data sets to a centralized location, enabling the data to be visualized, analyzed, widely distributed via existing web services and the Global Telecommunications System (GTS) and archived at the National Centers for Environmental Information (NCEI). The IOOS Glider Dac is accessible through rerddap (http://data.ioos.us/gliders/erddap/). Extracting and plotting salinity from part of the path of one glider deployed by the Scripps Institution of Oceanography:
urlBase <- "https://data.ioos.us/gliders/erddap/"
gliderInfo <- info("sp064-20161214T1913",  url = urlBase)
glider <- tabledap(gliderInfo, fields = c("longitude", "latitude", "depth", "salinity"), 'time>=2016-12-14', 'time<=2016-12-23', url = urlBase)
glider$longitude <- as.numeric(glider$longitude)
glider$latitude <- as.numeric(glider$latitude)
glider$depth <- as.numeric(glider$depth)
require("plot3D")
scatter3D(x = glider$longitude , y = glider$latitude , z = -glider$depth, colvar = glider$salinity, col = colors$salinity, phi = 40, theta = 25, bty = "g", type = "p",
           ticktype = "detailed", pch = 10, clim = c(33.2,34.31), clab = 'Salinity',
           xlab = "longitude", ylab = "latitude", zlab = "depth",
           cex = c(0.5, 1, 1.5))

Key Points
There are keypackages necessary to import data from ERDDAP into Python: pandas
Data can be downloaded locally or be interacted with directly using erddapy
You can asses your data package in Python
Aggregating multiple datasets
Overview
Teaching: 30 min
Exercises: 0 minQuestions
How can I work with different datasets?
Objectives
Importing data from different ERDDAP servers into your Python environment
Compare different datasets
Map spatial datasets together
Aggregating datasets
Exercise: We want to plot surface temperature of different datasets with each other.
Note; We will be importing datasets from different servers, bear in mind that the granularity (time interval, sensor types) are different and needs to be taken into account when actually comparing these dataset.
-
Location: Location: Oregon Coast.
-
Date range: [2017-01-13 till 2017-01-16], UTC time.
-
Variable: Surface temperature
Link to static Jupyter Notebook. Copy/Paste the code blocks into your own Jupyter Notebook
OOI temperature dataset - Oregon Coast 2017
Import an OOI dataset. Background on the dataset we are importing here and here :
- Coastal endurance Array
- Platform: Oregon Inshore Surface Monitoring
- Instrument CTD.
#Import erddap package
from erddapy import ERDDAP

# ooi constructor:

e = ERDDAP(
    server= " https://erddap.dataexplorer.oceanobservatories.org/erddap/",
    protocol="tabledap",
    response="csv",
)

e.dataset_id = "ooi-ce01issm-rid16-03-ctdbpc000"
e.variables = [
    "longitude",
    "latitude",
    "time",
    "sea_water_temperature"
]
e.constraints = {
    "time>=": "2017-01-13T00:00:00Z",
    "time<=": "2017-01-16T23:59:59Z",}
Check the URL
# Print the URL - check
url = e.get_download_url()
print(url)
Import the dataset into the pandas dataframe and check the lay-out
# Convert URL to pandas dataframe
df_ooi_2017 = e.to_pandas(
    parse_dates=True,
).dropna()

df_ooi_2017.head()
df_ooi_2017
Plot the data
df_ooi_2017.plot (x='longitude (degrees_east)',
                    y='latitude (degrees_north)',
                    kind = 'scatter',
                    c='sea_water_temperature (degree_Celsius)',
                    colormap="YlOrRd")
OOI temperature dataset 2018 - Oregon Coast
#Import erddap package into
from erddapy import ERDDAP
# ooi constructor:

e = ERDDAP(
    server= " https://erddap.dataexplorer.oceanobservatories.org/erddap/",
    protocol="tabledap",
    response="csv",
)

e.dataset_id = "ooi-ce01issm-rid16-03-ctdbpc000"
e.variables = [
    "longitude",
    "latitude",
    "time",
    "sea_water_temperature"
]
e.constraints = {
    "time>=": "2018-01-13T00:00:00Z",
    "time<=": "2018-01-13T23:59:59Z",}
print ('done')
# Print the URL - check
url = e.get_download_url()
print(url)
# Convert URL to pandas dataframe
df_ooi_2018 = e.to_pandas(
    parse_dates=True,
).dropna()

df_ooi_2018.head()
print (df_ooi_2018)
Combining the datasets
averaging the datasets
Convert the objects to datetime objects
import pandas as pd
print (df_ooi_2017.dtypes)
df_ooi_2017["time (UTC)"] = pd.to_datetime (df_ooi_2017["time (UTC)"], format = "%Y-%m-%dT%H:%M:%S")

print (df_ooi_2017.dtypes)
import pandas as pd
print (df_ooi_2018.dtypes)
df_ooi_2018["time (UTC)"] = pd.to_datetime (df_ooi_2018["time (UTC)"], format = "%Y-%m-%dT%H:%M:%S")

print (df_ooi_2017.dtypes)
df_ooi_2017_average = df_ooi_2017.groupby(df_ooi_2017["time (UTC)"].dt.hour)['sea_water_temperature (degree_Celsius)'].mean().reset_index()
print (df_ooi_2017_average)
df_ooi_2018_average = df_ooi_2018.groupby(df_ooi_2018["time (UTC)"].dt.hour)['sea_water_temperature (degree_Celsius)'].mean().reset_index()
print (df_ooi_2018_average)
%matplotlib inline

import matplotlib.pyplot as plt

plt.figure(figsize=(12,5))
plt.plot(df_ooi_2017_average["time (UTC)"],df_ooi_2017_average["sea_water_temperature (degree_Celsius)"],label='2017',c='red',marker='.',linestyle='-')
plt.plot(df_ooi_2018_average["time (UTC)"],df_ooi_2018_average["sea_water_temperature (degree_Celsius)"],label='2018',c='blue',marker='.',linestyle='-')
plt.ylabel('degrees celsius')
plt.title("January 13th")
plt.legend()
plt.yticks(rotation=90)


#fig, (ax1, ax2) = plt.subplots(2)
#fig.suptitle('Vertically stacked subplots')
#ax1.plot(df_bcodmo["time (UTC)"],df_bcodmo['temperature'],label='bcodmo',c='red',marker='.',linestyle='-')
#ax2.plot(df_ooi["time (UTC)"],df_ooi["sea_water_temperature (degree_Celsius)"],label='OOI',c='blue',marker='.',linestyle='-')
#ax1.set(ylabel='degrees celsius')
#ax2.set(ylabel='degrees celsius')
Key Points
There are keypackages necessary to import data from ERDDAP into Python: pandas, urllib
Data can be downloaded locally or be interacted with directly using erddapy
You can asses your data package in Python
Gridded dataset
Overview
Teaching: 20 min
Exercises: 0 minQuestions
How can I work with gridded datasets
Objectives
Downloading satellite data from ERDDAP in netCDF format
Extracting data with Python
Map spatial datasets
Working with gridded data
Gridded data works with a different protocol called griddap. Instead of using the erddapy library. It is easier to import the data in .netcdf using the package xarray and netcdf.
Setting the constraints with this packageg is a bit more straightforward
griddap request URLs must be in the form https://coastwatch.pfeg.noaa.gov/erddap/griddap/datasetID.fileType{?query}
For example, https://coastwatch.pfeg.noaa.gov/erddap/griddap/jplMURSST41.htmlTable?analysed_sst[(2002-06-01T09:00:00Z)][(-89.99):1000:(89.99)][(-179.99):1000:(180.0)]
The query is often a data variable name (e.g., analysed_sst), followed by [(start):stride:(stop)] (or a shorter variation of that) for each of the variable’s dimensions (for example, [time][latitude][longitude]).
Link to static Jupyter Notebook. Copy/Paste the code blocks into your own Jupyter Notebook
xarray works similarly as the pandas data package.
import xarray as xr
import netCDF4 as nc
Satellite data NASA sea surface temperature : GHRSST Global 1-km Sea Surface Temperature (G1SST), Global, 0.01 Degree, 2010-2017, Daily The data contains daily composites of SST with 1 km resolution
Importing the downloaded data in Python. Now that we’ve downloaded the data locally, we can import it and extract our variables of interest:
import xarray as xr

server = 'https://coastwatch.pfeg.noaa.gov/erddap'
protocol = 'griddap'
dataset_id = "jplG1SST"
full_URL = '/'.join([server,protocol,dataset_id])
print(full_URL)
da = xr.open_dataset(full_URL)
Inspect the dataframe:
print (da)
Getting the dataset without subsetting it creates an error -> the data set is too large to be downloaded completely.
sst = da['SST']
sst
Create subsets of your netcdf file:
For this exercise, the area we are interested in includes Monterey Bay, CA:
- Latitude range: 44.0N, 48.0N
- Longitude range: -128E, -121E
- Time range 2017-01-13T00:00:00Z to 2017-01-16T23:59:59Z
Xarray supports:
- label-based indexing using .sel
- position-based indexing using .isel
slice() function can take three parameters:
- start (optional) - Starting integer where the slicing of the object starts. Default to None if not provided.
- stop - Integer until which the slicing takes place. The slicing stops at index stop -1 (last element)
import xarray as xr

server = 'https://coastwatch.pfeg.noaa.gov/erddap'
protocol = 'griddap'
dataset_id = "jplG1SST"
full_URL = '/'.join([server,protocol,dataset_id])
print(full_URL)
da = xr.open_dataset(full_URL)


sst = da['SST'].sel(
                  latitude=slice(44., 48.),
                  longitude=slice(-128, -121),
                  time='2017-01-13T00:00:00'
                 )
sst
%matplotlib inline
sst.isel(time=0).plot.imshow()
Key Points
There are key packages necessary to import data from ERDDAP into Python: xarray
xarray works similar to Pandas
xarray has a build in plotter for gridded datasets